RawGraphs
Data ToolsDescription
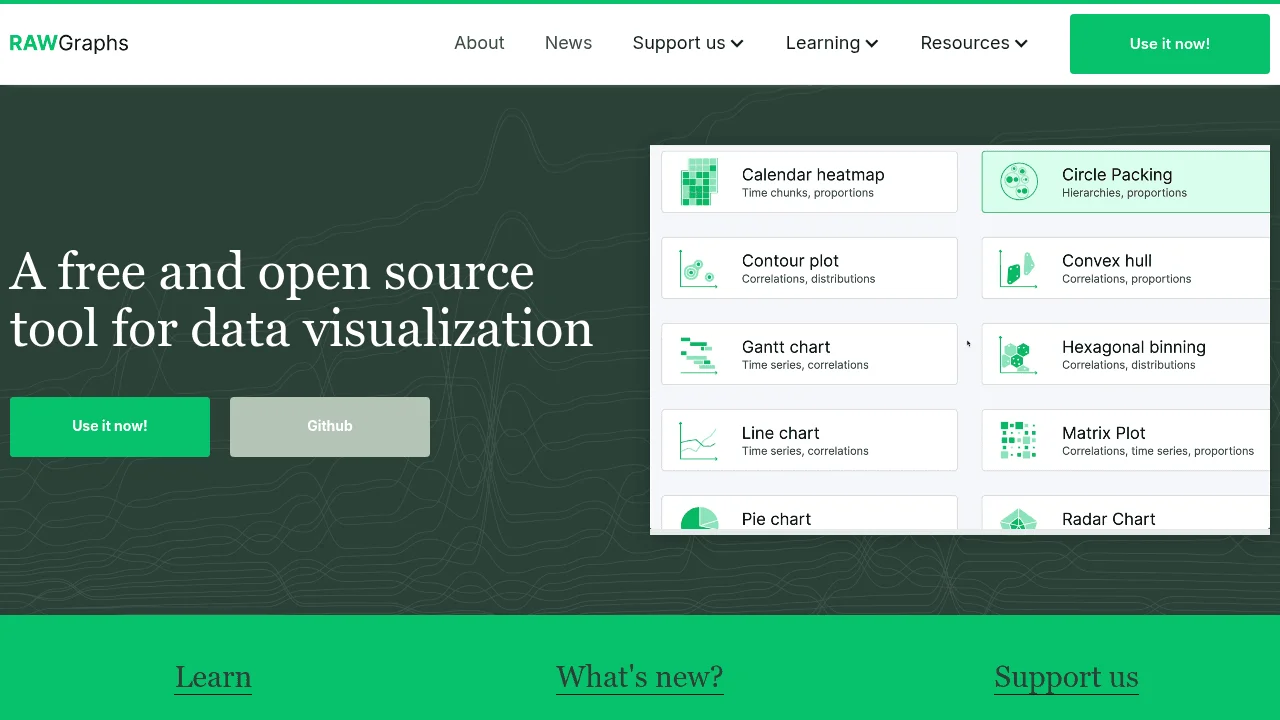
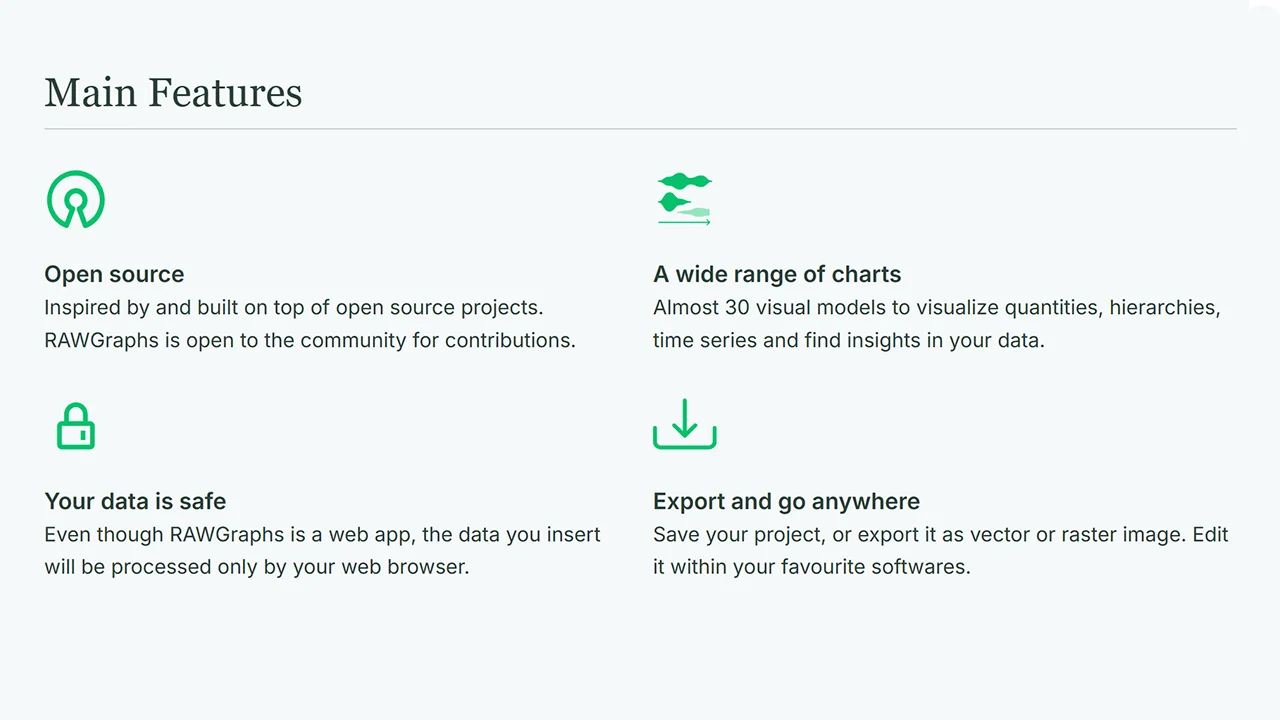
RawGraphs transforms raw datasets into sophisticated visualizations through an intuitive drag-and-drop interface. The tool supports 20+ chart types including sankey diagrams, hive plots, and circular packing - formats rarely found in mainstream tools. Users upload CSV/Excel files, map columns to visual dimensions, and refine aesthetics with granular controls. All processing happens in-browser, ensuring data privacy for sensitive information. While offering advanced customization, it requires no programming knowledge to generate publication-ready SVG/PNG exports. The open-source platform is particularly valuable for researchers, journalists, and analysts needing to reveal complex relationships in data through unconventional but accurate representations. Templates and tutorials help newcomers master less common visualization techniques quickly.
Screenshots
Tags
Related Tools
CSVJSON
Convert between CSV and JSON formats instantly with advanced options for data cleaning and transformation.
CSVLint
Validate CSV readability and schema compliance with detailed feedback and customizable dialect options.
Datawrapper
Create responsive charts, maps, and tables with clean design for publications without coding or design skills.
LiveGap Charts
Create interactive charts and graphs instantly with this easy-to-use online chart builder.

