Datawrapper
Data ToolsDescription
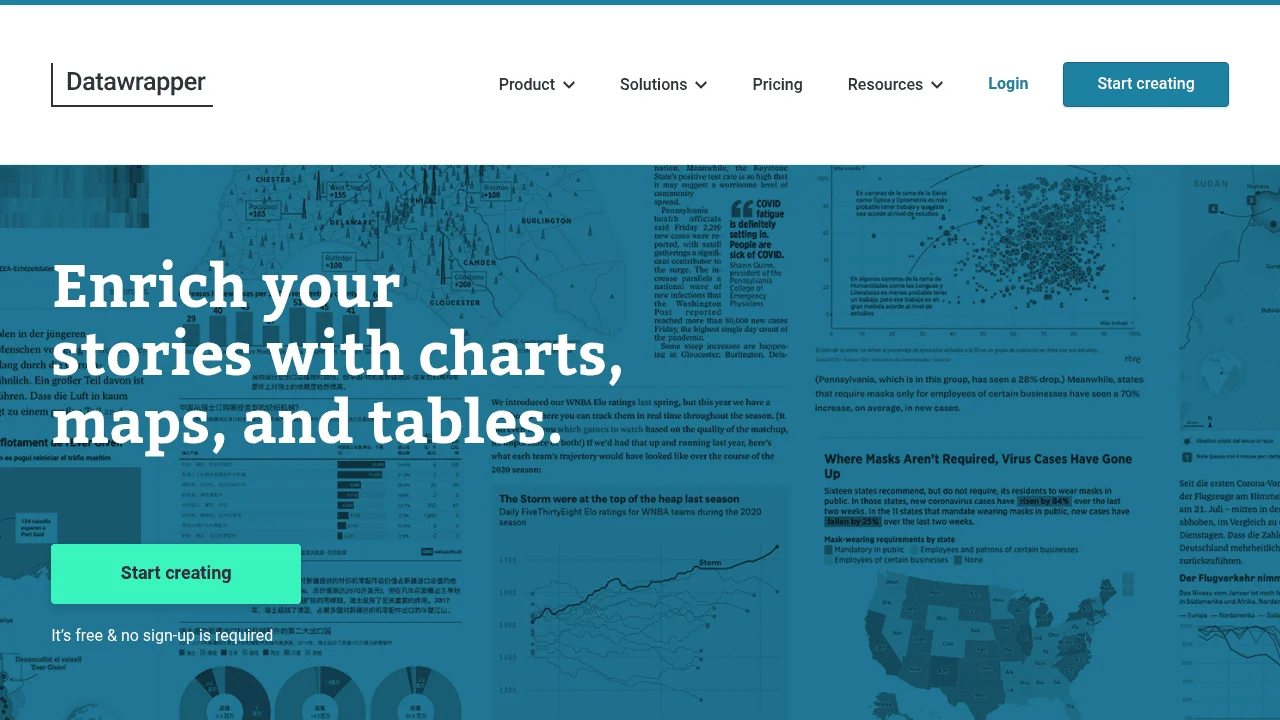
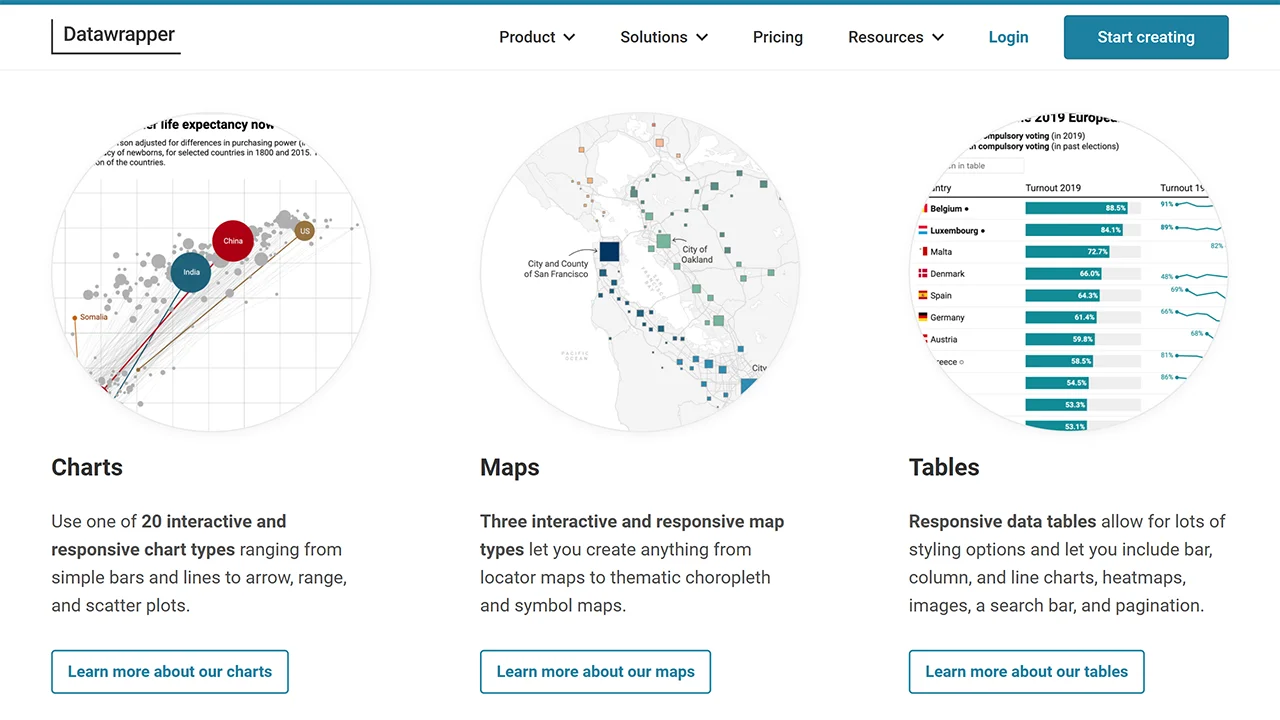
Datawrapper is a user-friendly online tool designed to help users create interactive and responsive data visualizations without any coding or design skills. It offers a range of chart types, including bar, line, dot, and pie charts, as well as maps and tables. Users can import data from various sources such as CSV files, Excel, or Google Sheets, and customize their visualizations through a simple four-step process: uploading data, choosing a chart type, customizing the design, and embedding or exporting the final visualization. The free plan allows unlimited visualizations with export options in PNG, SVG, or PDF formats. Visualizations are private by default and can be shared or embedded once published. Datawrapper is widely used by journalists, educators, and organizations to present data in an accessible and engaging manner.
Screenshots
Tags
Related Tools
CSVJSON
Convert between CSV and JSON formats instantly with advanced options for data cleaning and transformation.
CSVLint
Validate CSV readability and schema compliance with detailed feedback and customizable dialect options.
RawGraphs
Open-source data visualization framework for creating custom charts from CSV/Excel data without coding.
LiveGap Charts
Create interactive charts and graphs instantly with this easy-to-use online chart builder.