LiveGap Charts
Data ToolsDescription
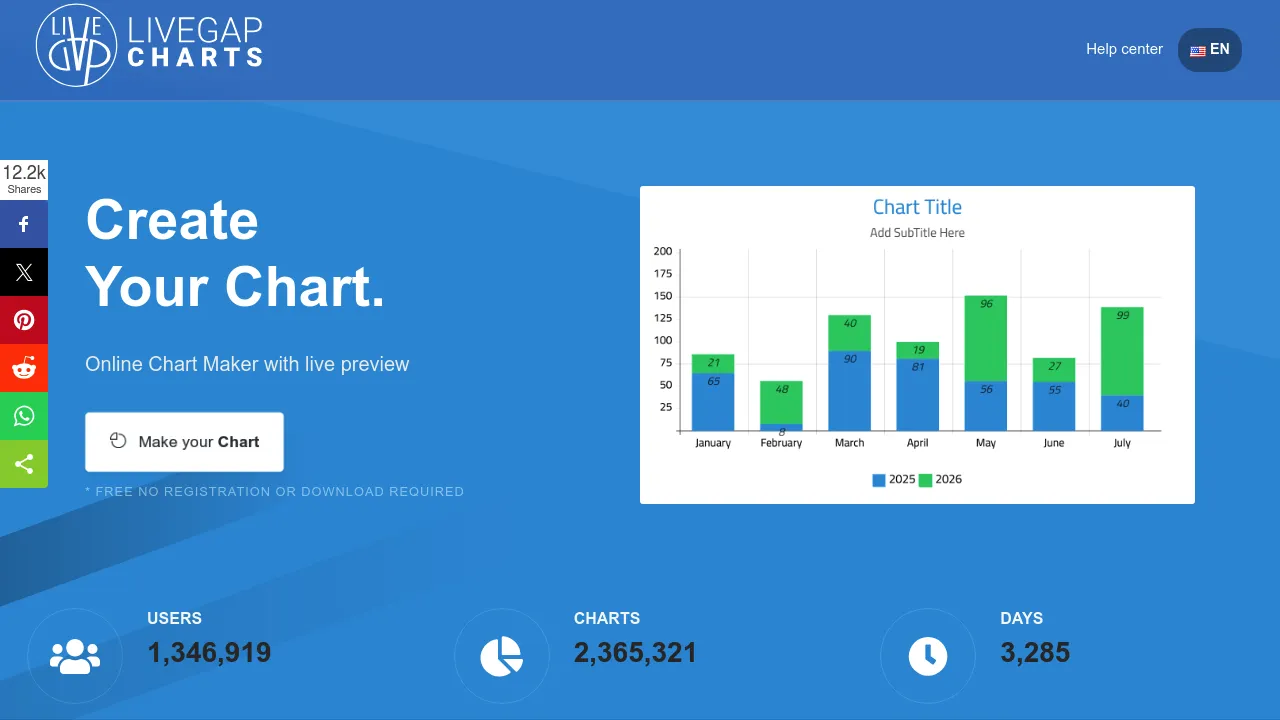
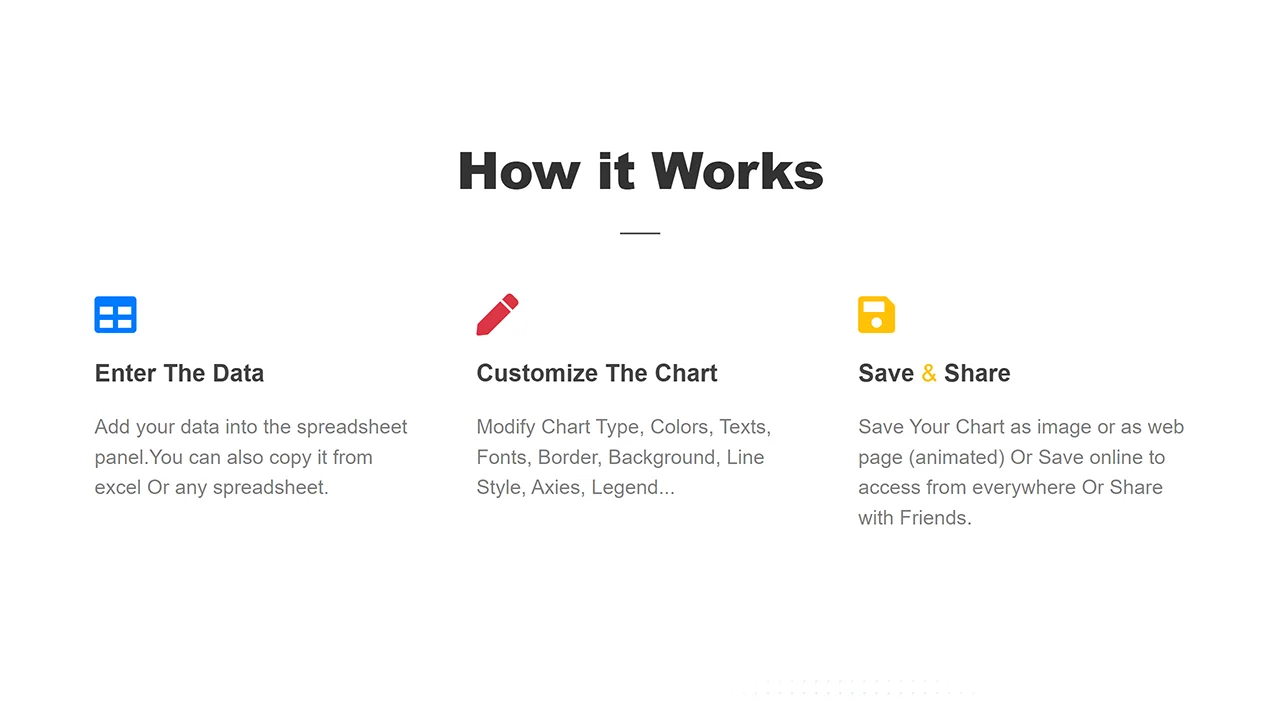
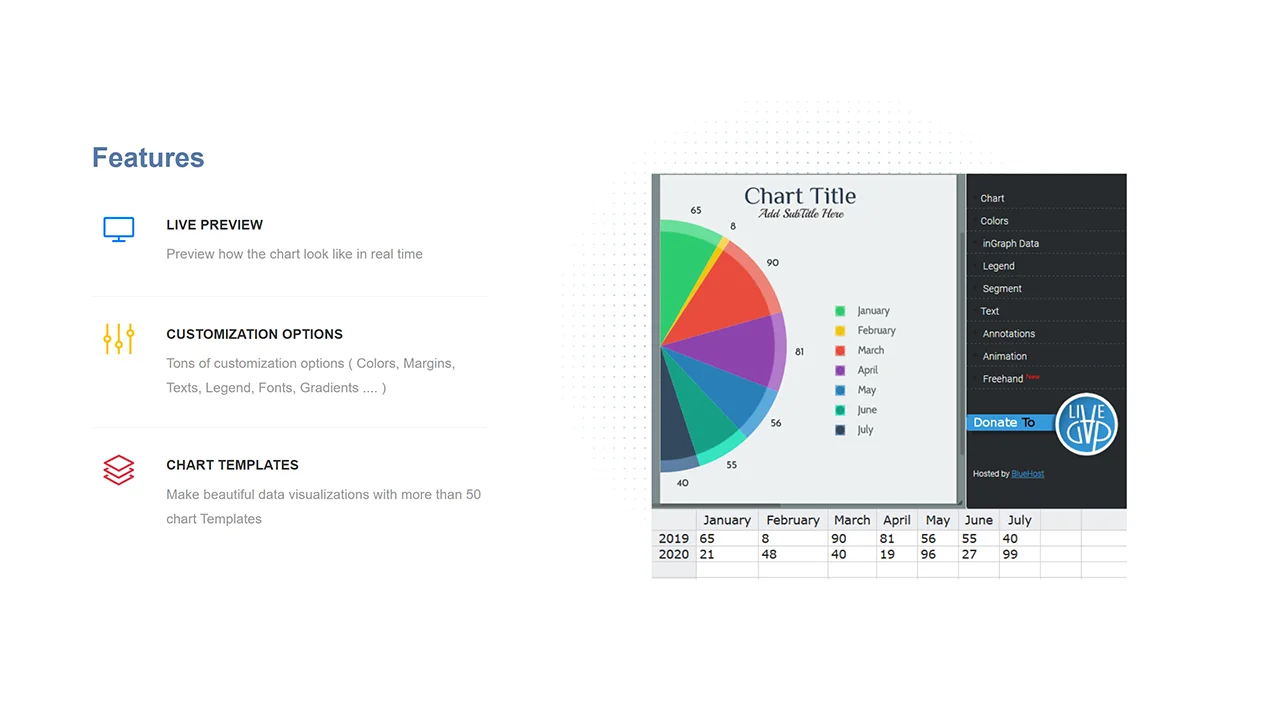
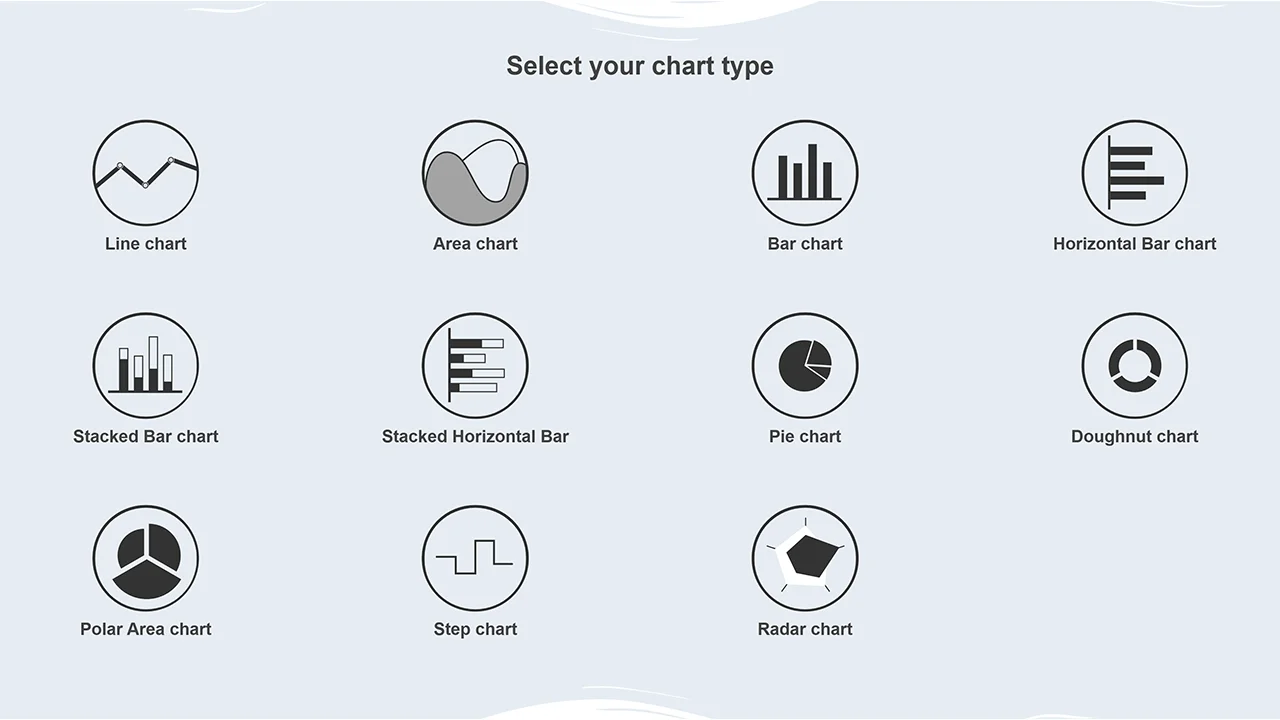
LiveGap Charts is a free online tool for generating interactive and visually appealing charts quickly. Users can create bar, line, pie, and other chart types with custom data, colors, and labels, making it ideal for presentations, reports, or web projects. Its intuitive interface delivers instant results directly in the browser - no signup required.
Screenshots
Related Tools
ChartGo
Design custom charts and graphs online quickly with this simple and versatile chart builder.
CSVJSON
Convert between CSV and JSON formats instantly with advanced options for data cleaning and transformation.
CSVLint
Validate CSV readability and schema compliance with detailed feedback and customizable dialect options.
Datawrapper
Create responsive charts, maps, and tables with clean design for publications without coding or design skills.